Body Mass Index is probably the most widely recognized health metric in the world. Your doctor calculates it. Insurance companies use it. Fitness apps display it. And yet BMI has been called "dangerously flawed," "a relic," and "the laziest measure in medicine" — sometimes by the same researchers who acknowledge they can't quite stop using it.
The truth is more nuanced than either side admits. BMI is a 190-year-old formula invented by a Belgian statistician who explicitly said it shouldn't be used on individuals. It tells you nothing about body composition, fat distribution, or metabolic health. But at the population level, it remains one of the strongest predictors of chronic disease risk we have — and for many people, it's genuinely useful.
This article walks through what BMI actually is, where it works, where it breaks down, and what better tools exist. If you've ever felt confused or frustrated by your BMI number, you're about to understand exactly what it means — and what it doesn't.
A Brief History: The Formula That Wasn't Meant for You
BMI was born in 1832, when Adolphe Quetelet — a Belgian astronomer, mathematician, and statistician — was attempting to define the characteristics of the "average man" using probability theory. He noticed that in adult populations, body weight scaled proportionally to the square of height. The formula was simple: weight in kilograms divided by height in meters squared.
Quetelet was explicit: this index was a statistical tool for describing populations. It was never designed to assess the health of any individual person.
For over a century, the Quetelet Index sat quietly in academic literature. Then, in 1972, physiologist Ancel Keys analyzed data from 7,426 men across 12 populations and concluded that Quetelet's formula was the most convenient way to estimate relative weight in large studies. Keys coined the term "Body Mass Index" and, despite acknowledging its limitations, recommended it as a practical shortcut.
In 1985, the National Institutes of Health adopted BMI as an official obesity identifier. In 1998, the thresholds were revised downward — overnight, millions of Americans who had been "normal weight" became "overweight" without gaining a single pound.
This history matters because it reveals what BMI was and wasn't designed to do. It's a population-level screening tool that has been repurposed — often clumsily — as an individual diagnostic.
How BMI Is Calculated
The formula is straightforward:
BMI = weight (kg) / height (m)²
Or in imperial units: BMI = (weight in lbs × 703) / (height in inches)²
The result maps to four standard categories:
| Category | BMI Range |
|---|---|
| Underweight | Below 18.5 |
| Normal weight | 18.5 – 24.9 |
| Overweight | 25.0 – 29.9 |
| Obese | 30.0 and above |
These thresholds were established by the World Health Organization and are used globally — which is itself part of the problem, as we'll see.
What the formula actually computes is the ratio of your mass to the square of your height. It does not distinguish between muscle mass and fat mass. It does not know where your fat is stored. It has no idea whether you're an Olympic weightlifter or a sedentary office worker. It is, by design, crude.
Where BMI Works: The Population-Level Case
Despite its limitations, BMI remains in widespread clinical use for a reason: at the population level, it correlates with health outcomes.
Large epidemiological studies consistently show that BMI in the 18.5–24.9 range is associated with the lowest all-cause mortality. As BMI rises above 30, risks of type 2 diabetes, cardiovascular disease, certain cancers, and premature death increase substantially. A StatPearls review confirmed that higher BMI is associated with increased risk of myocardial infarction, stroke, and type 2 diabetes across large populations.
For public health — identifying which populations are at risk, tracking obesity trends over time, allocating healthcare resources — BMI is efficient, cheap, and requires only a scale and a measuring tape. No blood test, no imaging, no specialist equipment.
For clinical screening, BMI serves as a reasonable first filter. If your BMI is 32, your doctor has reason to investigate further. If it's 22, the urgency is lower. It's a triage tool, not a diagnosis.
Where BMI Fails: Five Major Blind Spots
1. It Can't Tell Muscle from Fat
This is the most well-known limitation. A muscular 90 kg man who is 180 cm tall has a BMI of 27.8 — classified as "overweight." A sedentary man of the same height and weight, carrying most of that mass as body fat, gets the same classification. Their health profiles are entirely different.
Research published in PLOS ONE quantified this problem: in a population-based sample, muscularity accounted for a significant portion of BMI variability, particularly in men. The study concluded that BMI "conflates" fat mass and muscle mass in ways that systematically misclassify individuals.
2. It Ignores Fat Distribution
Where you carry fat matters enormously. Visceral fat — stored around internal organs in the abdominal cavity — is far more metabolically dangerous than subcutaneous fat stored under the skin on your hips or thighs.
Two people with identical BMIs can have drastically different visceral fat levels. BMI cannot detect this difference. A landmark meta-analysis of 82,864 participants from nine cohort studies found that waist-to-hip ratio and waist circumference were better predictors of cardiovascular disease mortality than BMI — specifically because they capture abdominal fat distribution.
3. It Varies by Ethnicity
BMI thresholds were established primarily from data on White European and American populations. But body composition varies significantly across ethnicities.
A critical review in the American Journal of Human Biology found that African American individuals had approximately 10–11% greater skeletal muscle mass compared to Caucasian individuals at the same BMI. Conversely, research has shown that South Asian and East Asian populations tend to have higher body fat percentages at the same BMI, with metabolic risk appearing at lower BMI thresholds.
The WHO has acknowledged this issue, suggesting lower BMI cutoffs for Asian populations (overweight at 23, obese at 27.5), but these adjusted thresholds are not universally applied.
4. It Changes Meaning with Age
BMI was designed for working-age adults. In older populations, the relationship between BMI and mortality shifts. Multiple studies have found that the "overweight" BMI range (25–29.9) is actually associated with the lowest mortality in adults over 65 — a phenomenon called the "obesity paradox."
This likely reflects the protective effects of lean mass reserves against illness, falls, and frailty. A higher BMI in older adults often means they have more muscle (and some fat) to draw on during illness. BMI can't distinguish this protective weight from harmful excess.
5. It Misses Metabolic Health
Perhaps the most critical failure: BMI tells you nothing about what's happening inside your body. Blood pressure, blood sugar, cholesterol, insulin resistance, inflammation markers — these are the actual drivers of cardiometabolic disease, and BMI is at best an indirect proxy.
Some people with a BMI of 32 have perfectly normal metabolic markers ("metabolically healthy obesity"). Others with a BMI of 24 have prediabetes, hypertension, and dangerous visceral fat levels ("normal weight obesity" or "thin outside, fat inside"). BMI misses both.
Better Alternatives (and Why They Haven't Replaced BMI)
Several metrics address BMI's blind spots:
Waist circumference (WC): Measures abdominal fat directly. Risk thresholds: >102 cm (40 in) for men, >88 cm (35 in) for women. Simple to measure, better than BMI for predicting cardiovascular risk.
Waist-to-hip ratio (WHR): Divides waist measurement by hip measurement. Captures fat distribution pattern. Research has shown it to be the dominant risk factor predicting cardiovascular death in population studies.
Waist-to-height ratio (WHtR): Your waist should be less than half your height. Arguably the simplest and most consistent rule of thumb across populations.
Body fat percentage: Measures actual fat mass using calipers, bioelectrical impedance, DEXA scans, or hydrostatic weighing. More accurate than BMI but requires equipment.
Metabolic panels: Blood glucose, HbA1c, lipid profile, blood pressure — these measure the actual risk factors that BMI tries to proxy for.
So why hasn't BMI been replaced? Pragmatism. BMI requires a scale and a tape measure. Waist circumference is nearly as simple but less standardized (where exactly do you measure?). Body fat percentage requires equipment. Blood panels require a lab visit. For population screening, BMI's simplicity is hard to beat.
The best approach is layered: use BMI as a starting point, then add context — waist circumference, activity level, body composition estimates, and metabolic markers. No single number tells the full story.
How to Use Your BMI Intelligently
Here's a practical framework for making BMI useful rather than misleading:
If your BMI is below 18.5: This warrants attention regardless of other factors. Underweight is associated with increased mortality, weakened immunity, bone loss, and fertility issues. Discuss with your doctor.
If your BMI is 18.5–24.9: For most people without high muscle mass, this suggests healthy weight territory. But don't stop here — check your waist circumference and metabolic markers. "Normal weight obesity" is real and carries risk.
If your BMI is 25–29.9: Context matters enormously. If you're physically active with significant muscle mass, this number may be misleading. If you're sedentary with a waist circumference above the risk threshold, take it seriously. The research is clear that this range includes both genuinely healthy and genuinely at-risk individuals.
If your BMI is 30+: The statistical association with health risks becomes strong. Even here, metabolic health varies — but the probability of metabolic complications increases significantly, and most clinical guidelines recommend active weight management.
Track the trend, not the snapshot. A BMI of 29 that's been dropping from 34 tells a very different story than a BMI of 29 that's been climbing from 24. Direction matters more than position.
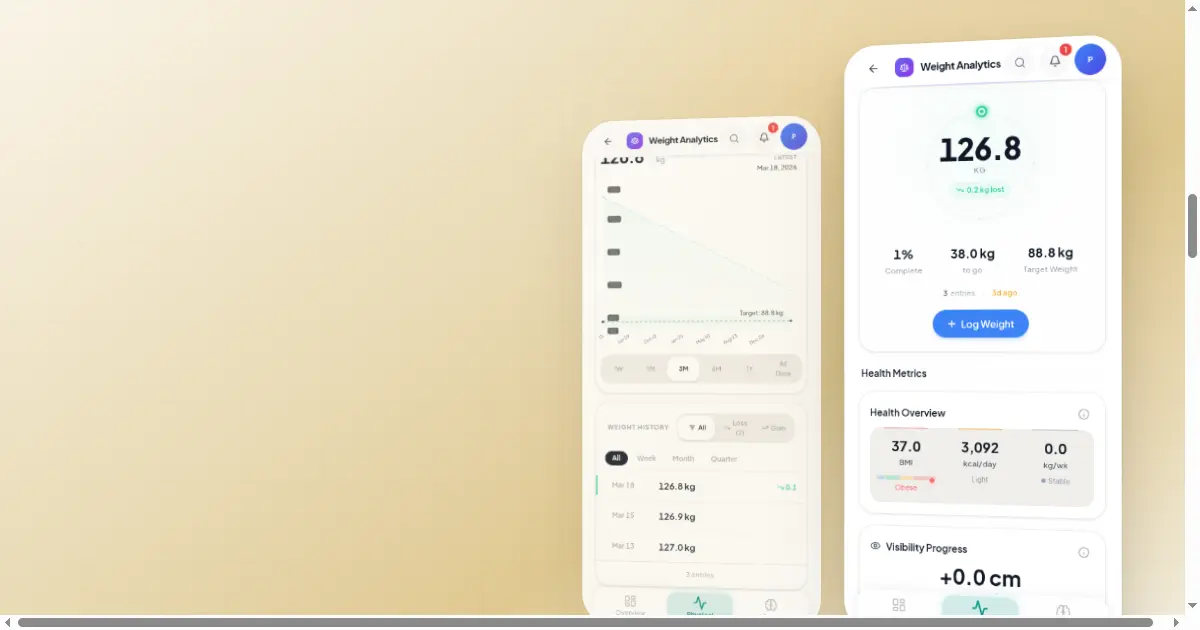
WatchMyHealth displays your BMI with a visual gauge showing exactly where you fall across the four categories — including the color-coded zones (blue for underweight, green for normal, amber for overweight, red for obese). It also calculates your daily caloric needs using the Mifflin-St Jeor equation, factoring in your age, gender, height, and activity level. The combination of BMI trend + caloric context + weekly rate of change gives you a much richer picture than BMI alone.
BMI is like a map from 1832 — roughly accurate, missing important details, but still useful for figuring out which direction to go. Just don't mistake the map for the territory.